You have just created a website and now, as a brand-new webmaster, you want to be successful and thriving online.
It’s normal!
In this guide, you’ll discover how to consult and study all your website statistics and performances.
To analyse your website, you’ll need to list these main aspects:
It’s quite a lot, but don’t worry! If you follow our advice, you’ll easily create the best website.
Optimize your website browsing
On the internet, there is a lot of information. To find your way around, you need to refer to well-structured and optimized websites.

To not lose users on your pages, pay attention to your menu, which is the main landmark on a website.
However, in addition to the menu, there are other browsing elements such as the links, buttons, and search bar.
Web browsing refers to all the elements that enable users to visit your website: call-to-action buttons, search bar, breadcrumb trail, back to top button…
To test the effectiveness of your navigation menu, ensure it enables to find the necessary information quickly (test with several examples) as well as clear with readable titles.
Create a high-performance website
Analyse your homepage to improve it
Your home page is the most important page on your website, and you need to work on it.
It plays an essential role in your browsing, and will also enhance your SEO and brand image. It will need to:
-
present your value proposition
-
have your main keywords
-
guide the visitor with a browsing menu and call-to-action buttons (CTA)
-
show reassurances and social proofs
Users just need a few seconds to decide if they remain or leave your website. An effective, complete and dynamic homepage maintains the link with visitors.
🚀 Here are the tools that may help you:
This tool helps you define the terms internet users search the most. It may help you to build your future content or feed your pages, especially your home page.

Most web experts use SEMrush, which probably is the most complete software. It’ll enable you to know the keywords your direct competitors often use, among others.

Landing page, form, and purchase funnel
When you analyse your blog or e-commerce platform, you’ll need to optimize these three elements to boost your sales or website traffic:
-
Landing page: these pages make conversion possible. Users arrive at them after clicking on a link or call-to-action button. Your landing pages need to be effective to not block the purchase or interaction process.
-
Forms: these are key points for the creation of an optimized and worthwhile email strategy for your website
-
Purchase funnel: it’s the process that encourages your visitors to take action (purchase, subscription…). Browsing elements define it and guide visitors.

You need to work on these three website settings to improve user and consumer experience. In this way, you’ll boost your conversion rate.
Analysis of your website traffic: SEO, the key element
Website structure, content, digital reputation are the 3 main elements of your SEO: you need to pay attention to them when you audit your website.
Complete SEO tools such as Google Search Console will help you implement a SEO strategy which is worthy of the greatest. Moreover, they offer you this data on the same interface.
However, to understand exactly the statistics you are consulting, here are some elements of analysis:
Website analysis: page structure
First, analyse your website structure; that is to say, how pages are organized:
Web crawlers need to read your website easily, quickly, and totally.
When web crawlers index your pages, they are mainly based on its structure, bold words, and links. Do your utmost so that Google shows your website for the most relevant keywords and understands your intentions.
To know if Google understands your pages perfectly, your website crawlability will need to be measured.
🚀 Here are the tools that will help you:
Screaming Frog is a software that will enable you to check and analyse all your website data. This crawler will boost your SEO.

Botify is based on the same principle, and serves to analyse your URL, which are essential for your organic SEO.

Do you have attractive content?
Of course, regarding SEO, content needs to be your first priority. It needs to be:
-
unique (non-duplicated or scraped on another website),
-
structured and prioritized thanks to HTML tags
-
have appropriate keywords which rank well
💡 Just add a main keyword per page
Work on your online reputation
Digital reputation refers to your website authority. It’s its digital aura, its virtual charisma.
You need to work on it: check your backlinks and the reputation of the leading websites because it’s the main criterion search engines take into account to determine if your website is reliable and an authority figure in their fields.
Here is the tool that will help you enhance your digital presence:
Ahrefs is a comprehensive software that gives access to many SEO tools. Netflix or Uber, the main current platforms, use Ahrefs which is also very useful to monitor your backlinks.

Analyse your website for an optimized technical aspect
To have good website’s performances, your website will need to meet some technical requirements. Here are some examples:
The latest web technologies
Ensure you keep your website technology up to date. There are more and more new features and algorithms on the internet: that’s why business intelligence is essential.
Moreover, ensure you have a high-performance website to protect data as well as remain effective and fast. If you update your website regularly, you optimize user experience.
🚀 Here are the tools that will help you improve your Google ranking:
BuiltWith is a useful extension for business intelligence. If you find a website that suits you, you can use this tool to know its technology.

SimilarTech is like BuiltWith. It gives information about all the technologies of a website.

Even if you caught visitors thanks to SEO and promotion, if your website loading speed exceeds 2 seconds, they will probably leave your website definitively.
Loading speed is indeed an essential element in SEO. Ensure your pages are fast, light, and available (almost) immediately on the Web.
Low loading speed might be due to heavy files such as photos or inappropriate technical elements.
🚀 Here are the tools that will help you boost your website traffic:
You just need to enter a page of your website to know its errors and optimization defaults.

This Google tool ensures an optimal loading time for your websites.

Responsive web design
Nowadays, your website must be responsive. Most internet users indeed surf the internet on mobile devices, and search engines penalize non-responsive websites.
Responsive web design enables you to have a user-friendly website that adapts to all screens (smartphone, desktop, tablet).
Therefore, ensure your website is responsive and adapts to a smartphone, tablet, or TV screen.
🚀 Here are the tools that will help you improve your responsiveness:
This tool is a reference. You can test your website and apps on the browser of your choice.

BBrowserShots tests your website design according to many configurations. Heavy or a little optimized designs might damage your website a lot.
Indicators about your website
To enhance your website and draw useful conclusions about your issues before launching strategies, you need to analyse your Key Performance Indicators (KPI). They will enable you to analyse your website deeply.
These indicators enable you to follow your website performance regularly, immediately and at any time. In this way, you remain attentive, on alert and quick to react.
It’s better to deal with a problem on your website immediately.
Analyse your website traffic
It’s essential to analyse your website traffic; that is to say, collecting information about your visitors’ geographic location and traffic source.
This analysis shows two indicators that enable you to get more information about your audience and adapt your website to her so that she finds you easily.
-
Where do your visitors come from? Pinterest, Instagram, or a backlink on other website?
-
Are your visitors French, English or Spanish speaking? Is it relevant to translate your entire website?
-
What’s the average age of your website visitors?
🚀 Here are the tools that will help you:
This open source software is interesting to analyse your website traffic, especially because it is compatible with many configurations.

This platform is a great option and enables you to collect almost the same data as Google Analytics: the geographic origin of your traffic, age group, traffic sources…

Google Analytics is the most famous Google tool for the analysis of your website traffic.

However, because of many exhaustive features, a beginner web designer may be lost when they analyse their website statistics.
Traffic sources
The visitors’ origin splits into 4 categories:
-
Direct: If an internet user entered your URL into the address bar of their browser, they are considered to be arrived directly on your website.
-
Referral: A referral website has a link that points to your website (partner website, directory, blog…). This category counts the internet users who arrive at your website by clicking a link.
In the GA chart, you’ll find the websites that give you most traffic. To know the exact targeting pages, click on the name of the website.
-
Search: This category counts the number of internet users who arrive at your website by clicking search results. The chart indicates the number of visits and pages viewed for each search engine that sends internet users to your website.
-
Paid: If you use an ad service or if you display ads on your website (using Google Ads, Microsoft AdCenter, Yahoo Search Marketing, for example), the visitors who come from these services will be counted into this category.
If you analyse the main traffic sources on your website, you’ll have the opportunity to create new customer acquisition strategies and adapt the ones you have already implemented.
Your website content
How to assess your content quality?
Check:
You can have more details about each page consulted:
However, interpret all these statistics correctly. For example, a high bounce rate may signify that your page gives all the necessary information, or it isn’t inviting and user-friendly and doesn’t encourage users to keep visiting your website.
Therefore, you need to consult and compare these statistics to make a complete analysis.
Keywords used on search engines
It’s possible to check the keywords internet users enter most to find your website. You can find the exhaustive list of keywords. For each key expression, it indicates:
You’ll see your website ranking for each key expression on Google.
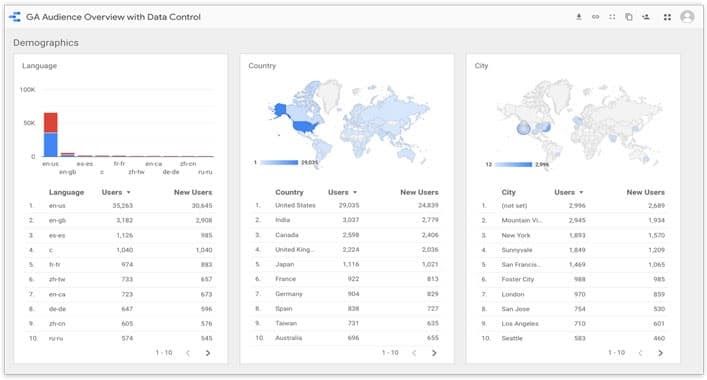
Visitors’ location
Maps with different parts of the world enable you to see quickly where your website visitors come from. You can accede to a list of countries from which your website was consulted.

For each country, you have access to:
Do you want to know precisely your visitors’ location?
It’s possible to accede to the regions and cities of your website visitors.
Do you understand? 📞
There are many settings you need to consider. Fortunately, if you are afraid of the amount of work, or if you don’t have time, note that you can hire web professionals’ services…
Professional website analysis: the last step for a real optimization
For an exhaustive, quick website analysis, web experts may help you.
Within a few days, they’ll determine your website strengths and weaknesses after analysing all your KPI carefully.
They’ll implement effective web strategies to get results on the internet.
An accurate report with concrete actions and methods to follow your web optimization will end the analysis of your website.
Create a high-performance website
Statistical analysis on SiteW
When you create your website with a website builder such as SiteW, you have direct and easy access to your Google Analytics account and the most important KPI on your website dashboard.
In this way, you understand better your statistics and interpret them correctly to take new decisions quickly.
Step 1: Connect Google Analytics with SiteW
To connect your SiteW account with your Google Analytics account, you need to have both.
If you create your Google Analytics account right now, you’ll have a code when you sign up. This code has the following format: UA-XXXXX-X and you need to preserve it.
Then go to My websites > Settings > Search engines.
A window will be displayed to connect SiteW with Google Analytics.

Do you remember the code? Add it to the provided section to link your accounts. On your dashboard, your first statistics will be displayed within one day.
There you go! 🥁
Google Search Console and Google Analytics are available directly on your SiteW dashboard.
But how to accede to your statistics?
Step 2: Consult your statistics
It’s easy!
You just need to sign in to your SiteW dashboard that lists all your websites created with our solution.
Click on the Statistics section of your dashboard, and then on Google console on the right.

You’ll have access to the data collected by Google summarized in graphs and diagrams to interpret them in the best way possible.
Now you are ready to analyse your website and rank higher on search results.
We wish you a great success on the internet! 🚀


